/perspectives/sector-views/high-yield-and-bank-loan-outlook-february-2025

Reframing Tight Spreads in Leveraged Credit
Adjusting spreads for fundamental factors.
High Yield and Bank Loan Outlook
First Quarter 2025
The economic backdrop in 2025 is expected to remain supportive of credit markets, with solid U.S. growth and moderate inflation fostering a relatively steady environment for high yield bonds and leveraged loans. While default risks persist, particularly in the loan market, robust fundamentals and strong investor demand for U.S. fixed income continue to underpin valuations.
High yield spreads of less than 300 basis points appear tight on a historical basis, but once adjusted for shifts in the quality of the current high yield market, they appear less rich. We anticipate some normalization in high yield credit spreads this year but expect any widening to be modest as long as the economy is growing. For leveraged loans, moderating defaults, driven in part by repricing activity, should support modest tightening in discount margins. Against this backdrop, disciplined positioning and selective industry and credit allocation will be important amid an uncertain policy environment.
Report highlights:
- The leveraged credit market delivered strong returns in 2024, reflecting a solid economy and robust investor demand for fixed income. High yield spreads narrowed sharply, ending the year near historic tights. Leveraged loans also performed well, although discount margins ended the year less rich than corporate spreads on a historical basis.
- Both fundamental and technical factors are supporting currently tight index spreads. But after adjusting for fundamental factors like leverage and interest coverage, high yield credit spreads appear somewhat cheaper compared to historical levels. Historically elevated yields are likely to continue to attract investors, maintaining a favorable supply/demand dynamic in credit markets.
- In 2025, we expect a positive macroeconomic backdrop and ongoing investor demand to support excess returns in leveraged credit.
Macroeconomic Outlook
Moderating Growth, Gradually Cooling Inflation
The U.S. economy enters 2025 on a path toward more moderate growth, which we expect to be around 2 percent, supported by resilient consumer spending. Inflation is gradually cooling, and we expect core personal consumption expenditures inflation to decline toward 2.5 percent by the end of 2025, with the timing and scale of new tariffs posing upside risks. The Federal Reserve (Fed) will likely proceed cautiously with rate cuts amid uncertainty over slowing inflation progress and policy shifts under the new administration. Our base case is that the Fed will cut two more times this year, lowering the fed funds rate to 3.75–4 percent, with some risk of more cuts.
The theme of bifurcation—uneven performance across sectors and industries—will persist. Although financial conditions have eased in aggregate, they continue to impose constraints on interest rate sensitive sectors like housing and manufacturing. Some policy changes could further amplify disparities across industries. Deregulation offers targeted relief to banking and energy, while tariffs could create winners and losers between domestic producers and importers. The elevated policy uncertainty adds complexity to the outlook for many businesses. Meanwhile, services sectors continue to drive growth.
Broadly, we believe macro conditions will support credit markets, with solid fundamentals in both households and the corporate sector helping contain downside risks to the economy. However, elevated policy uncertainty keeps tail risks high, requiring credit investors to remain selective. This selectivity is particularly critical in an environment where risk premiums are historically tight, and the market is pricing in significant optimism.
A Look Back and Look Ahead for Leveraged Credit
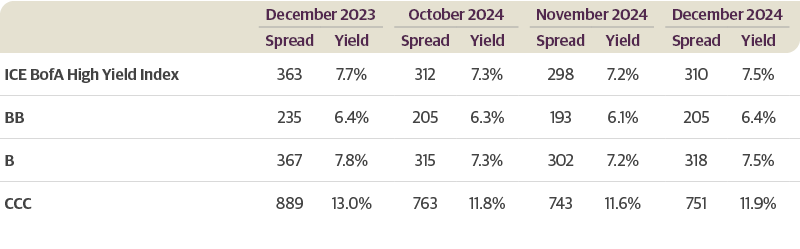
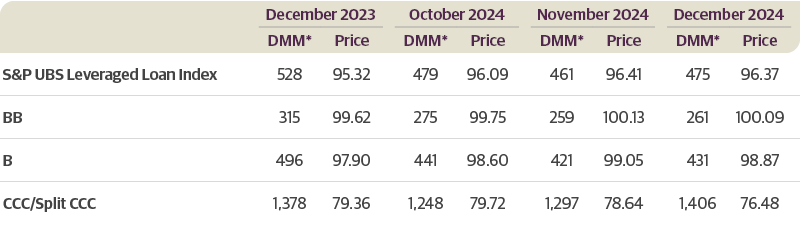
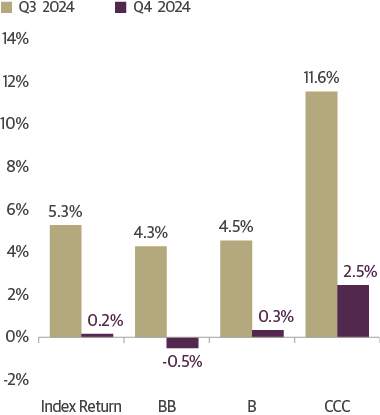
The leveraged credit market delivered strong returns in 2024, reflecting a risk-on environment and strong investor demand for fixed income. High yield corporate bonds returned 8.2 percent while U.S. leveraged loans returned 9 percent. Upgraded estimates for U.S. gross domestic product growth and strong investor demand fueled gains across the credit spectrum, with CCC-rated bonds and CCC-rated loans returning 18 percent and 12 percent, respectively, outperforming BB and B-rated credits. As a result of this strong performance, spreads in the high yield bond market have tightened considerably. The early part of the first quarter 2025 has continued these trends.
The ICE BofA High Yield index spread now stands at just 268 basis points, 22 basis points off historical tights. The S&P UBS Leveraged Loan Index three-year discount margin is at 473 basis points, 243 basis points away from tights. Another way we measure these is in terms of percentiles, with bonds in the 1st percentile since 1997 and loans in the 46th percentile.
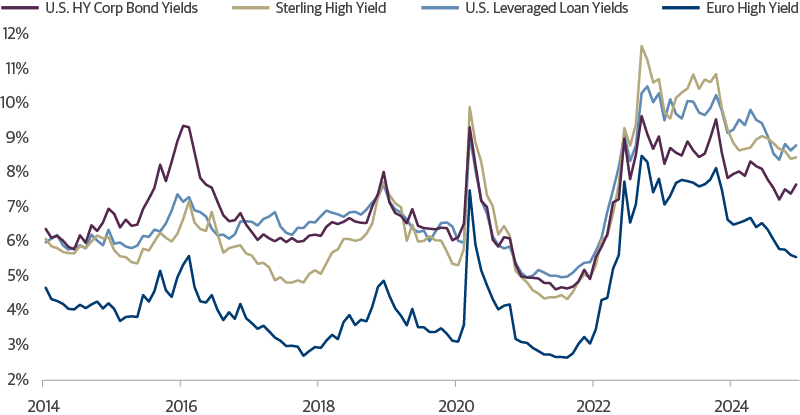
Credit Risk Premiums Tightened in 2024
High Yield Bond Index OAS and Bank Loan Index 3-Year Discount Margins
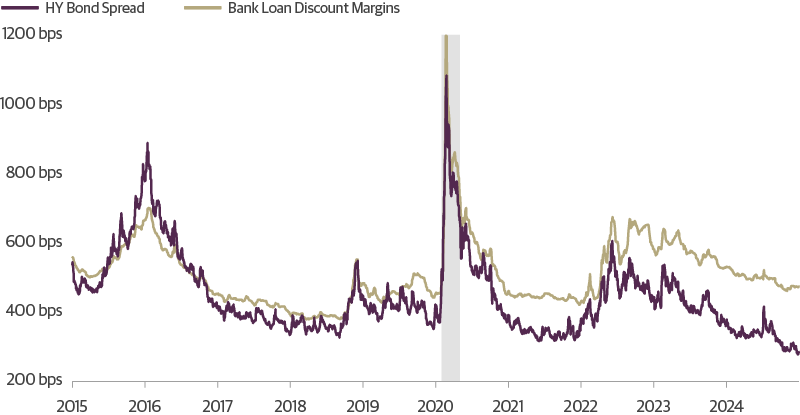
Source: Guggenheim Investments, Bloomberg, ICE Index Services. Data as of 1.29.2025. Based on the ICE BofA High Yield Index and the S&P UBS Leveraged Loan Index. Gray area represents recession. OAS = option-adjusted spread.
Default activity in 2024 explains some of the divergence between the two sectors. The ICE BofA High Yield par-weighted default rate declined to 1.4 percent by year end, down from 2.4 percent in 2023 and well below the decade average of 2.8 percent. In contrast, the UBS S&P Leveraged Loan par-weighted default rate rose to 3.4 percent, up from 1.9 percent the previous year and nearly double the decade average of 1.8 percent. This disparity reflects the greater sensitivity of floating-rate loans to rising interest rates, heavier exposure to capital-intensive sectors such as healthcare and media, and lower average credit quality in the loan market. Other dynamics played a role as well, including the presence of sponsors and the market’s adjustment to the aftermath of loan-only financing (with no other subordinated debt in the capital structure). This also drove a notable increase in liability management exercises—transactions designed to restructure debt through amendments or debt swaps, often as a proactive alternative to bankruptcy.
Default Cycle Divergence Between Bonds and Bank Loans
Trailing 12-Month Par-Weighted Default Rates (DR)
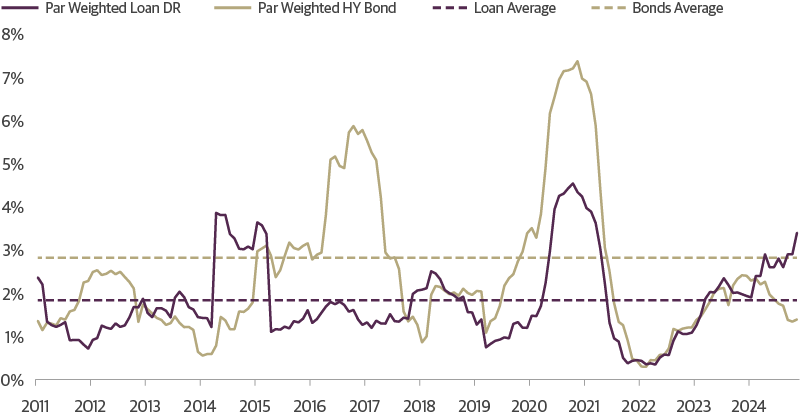
Source: Guggenheim Investments, BofA Global Research, UBS Research. Data as of 11.30.2024. Based on the ICE BofA High Yield index and the S&P UBS Leveraged Loan default rate. Distressed exchanges and liability management exercise are included.
Our macroeconomic outlook suggests a stable environment for credit, with default rates moderating. Yet risks remain elevated. Tight credit spreads, particularly in high yield corporates, leave little cushion for an increase in spreads or potential defaults, while policy uncertainty creates lingering tail risks. Still, we expect strong fundamentals and the persistent supply/demand imbalance that defined the past two years will likely contain any widening.
Better Fundamentals Help Justify Tight Corporate Spreads
Some of the spread compression is warranted by the shift toward higher quality issuers in the index. Adjusting spreads for quality, we find that spreads could remain at current levels. Specifically, the quality of the high yield bond market has improved over time, with BB-rated bonds now accounting for 52 percent of the index, up from a historical average of 42 percent. Conversely, CCC-rated bonds represent 14 percent of the index, below their historical average of 17 percent. These shifts significantly affect the market’s default risk. BB-rated bonds have had an average annual default rate of just 1 percent since 1980 and only 83 basis points outside of recessions—far below the 13 percent average annual default rate for CCCs (11 percent outside of recession). This reduced default risk helps explain lower risk premiums for the overall index. Without adjusting for these quality changes, high yield index spreads may appear richer relative to history than they actually are.
Higher Quality High Yield Over Time
Credit Profile of the High Yield Index
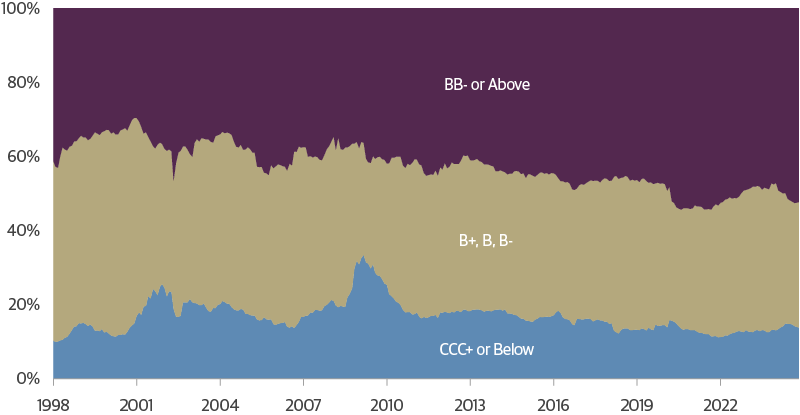
Source: Guggenheim Investments, Bloomberg, ICE Index Services. Data as of 12.31.2024.
In contrast, the bank loan market has become increasingly concentrated in B and B- issuers, which represent 55 percent of the index today versus 33 percent 10 years ago. BB rated loans used to be 35 percent of the market and are now just 24 percent. Again, this increased risk of default is reflected in wider spreads on the index.
High Yield Bond Market Quality Has Improved While Loans Have Worsened
Average High Yield Index and Bank Loan Index Credit Quality
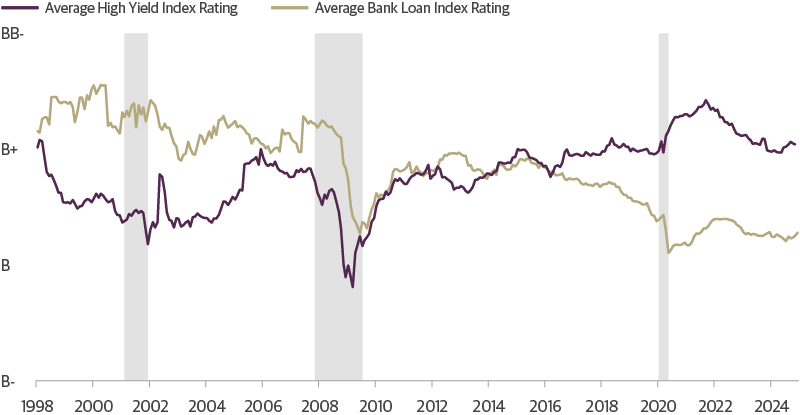
Source: Guggenheim Investments, ICE Index Services, UBS. Data as of 12.31.2024. Gray areas represents recession.
Two ways to control for this is to only look at rating-level percentiles or adjust the historical index by reweighting spreads based on today’s rating composition. Rating-level percentiles show that higher quality loans, specifically BB and B-rated, are richer to their history than the index-level percentile suggested, with BB and B loans in the 19th and 23rd percentiles. CCC loans are on the wider end of risk premiums relative to their history, in the 64th percentile, but much of this cheapness is due to the market pricing in likely default activity. Given loan market default trends and lingering uncertainty over the rate cutting cycle, we believe loss-adjusted CCC loan spreads will be lower.
At a rating level, high yield corporates look as rich as the index level measure presents, with BB and B-rated bonds in their 2nd and 1st percentiles of historical levels, while CCCs are in their 4th percentile. Reweighting the historical index levels based on today’s rating mix shifts high yield and bank loan market percentiles to the 3rd and 31st percentiles from the 1st and 46th percentiles, respectively—only making a material difference for loans.
Spread Percentiles Show High Quality Credit Looks Somewhat Rich
High Yield and Bank Loan Index Spreads, in Percentiles
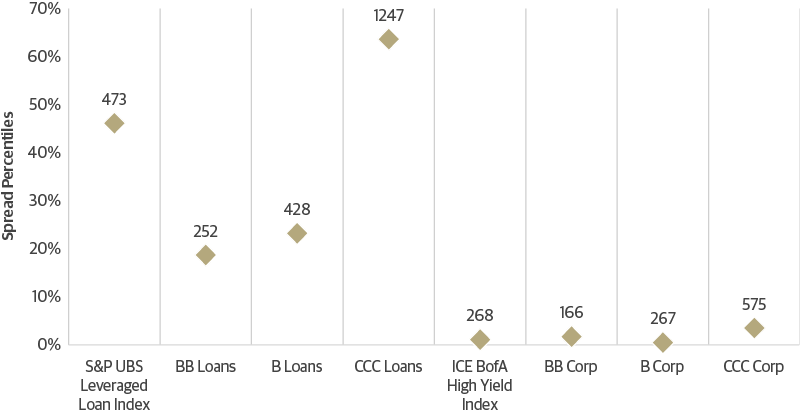
Source: Guggenheim Investments, Bloomberg, UBS, ICE Index Services. Data as of 1.29.2025.
Within ratings, we found that corporate issuers now have better-than-average interest coverage and leverage ratios, which are trends we incorporate into our assessment of value. For example, the median BB issuer leverage ratio was 3.1x as of the third quarter of 2024, below the 3.3x average since 1994. The median BB interest coverage ratio is 5.5x, above the 5x average. This measure has ranged from as low as 3x to as high as 7.5x over the past 30 years, underscoring its variability through cycles. Similar observations are true of B and CCC rated credits.
Stronger Corporate Balance Sheets with Better Coverage and Lower Leverage
Nonfinancial Corporate Leverage and Interest Coverage, Range, Current and Average
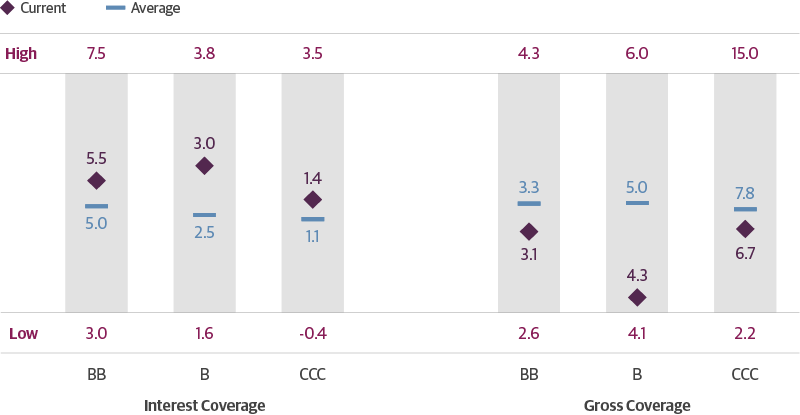
Source: Guggenheim Investments, S&P Global Ratings. Data as of 9.30.2024. Historical average, high and low are based on data from Q1 1994 – Q3 2024. Interest coverage is based on the ratio of earnings before interest, tax, depreciation and amortization and annual interest expense.
We can therefore adjust current corporate bond spreads by calculating metrics like spread-to-leverage and spread-to-coverage instead and comparing those measures across time. These ratios fluctuate with changes in credit spreads, but they also indicate whether investors have accepted less compensation for a given level of leverage or interest coverage. Incorporating these adjustments moves current high yield index spreads to the 15th percentile of valuations, from the 1st. All ratings shift to a cheaper percentile, with the most pronounced move in CCCs, which adjust from the 16th percentile to the 37th.
The same adjustment is not easily applied to bank loan spreads, as the private nature of the loan market limits visibility into rating-level fundamentals. However, we note that compared to the last decade, the median interest coverage in the public bank loan market is still above average, despite the decline in average credit quality in the market over this period. This is in part due to robust earnings growth and repricing activity that has allowed loan borrowers to manage interest costs, but we would caveat that it is mostly BB issuers that have publicly available data to track this.
This analysis suggests that there may be more relative value in current corporate bond spreads than based on index spreads alone. It also indicates that spreads may have capacity to absorb incremental shifts in quality. For instance, if corporate leverage rises modestly due to increased borrowing in 2025, the adjustment in spreads is likely to remain orderly because leverage ratios are only near the middle of the range and spread-to-leverage ratios are not at historical tights.
Credit Spreads Appear Cheaper Once Adjusted for Quality
High Yield Corporate Index Spreads and Adjusted for Fundamentals, Stated in Historical Percentiles
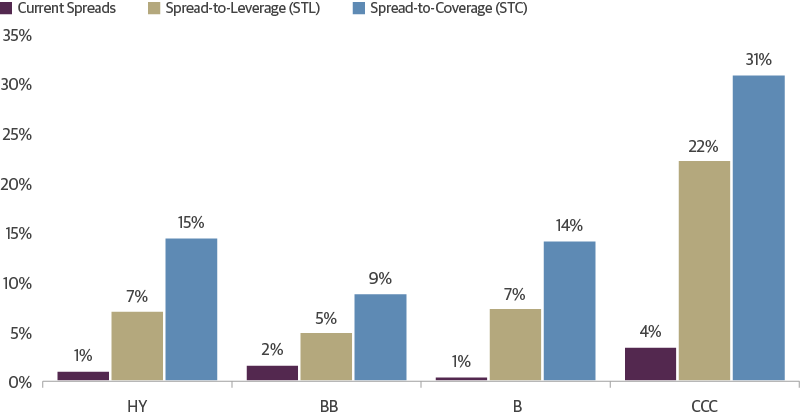
Source: Guggenheim Investments, Bloomberg, ICE Index Services, S&P Global Ratings. Data as of 1.29.2025. Based on spreads as a ratio to leverage and interest coverage from the prior quarter. Current ratios are based on Q3 2024 fundamentals given limited data availability.
Attractive Yields and Lower Net Supply Should Contain Spreads
In 2024, a persistent supply and demand imbalance also contributed to spread tightness across both high yield corporate bonds and bank loans. Though the impact is less quantifiable on the index spread level, it is equally important. After ultralow interest rates in 2021 spurred early refinancing activity, corporates had less debt to roll over in recent years. This was followed by the sharp rise in rates during the Fed hiking cycle, damping net new issuance from high yield bond and loan borrowers. As a result, in 2024, net new supply—though double 2023 levels—represented just 11 percent of the market outstanding, compared to 25 percent in 2021.
Tepid Net Issuance Persists in Leveraged Credit Markets
Leveraged Credit Net Issuance as a % of Market Outstanding
Source: Guggenheim Investments, Pitchbook LCD, ICE Index Services. Data as of 12.31.2024.
Meanwhile, demand for U.S. fixed income has been robust, driven by historically attractive yields and a favorable comparison to international markets. Yields on U.S. high yield bonds currently exceed 7 percent, significantly outpacing European equivalents, which yield below 6 percent. Similarly, yields on U.S. leveraged loans surpass 9 percent. With our baseline expectation of only two rate cuts this year, we believe these yields will maintain their relative appeal throughout 2025.
U.S. Fixed-Income Yields Are Competitive to Those Abroad
High Yield and Bank Loan Index Yield
Source: Guggenheim Investments, Bloomberg. Data as of 12.31.2024.
Investment Implications
Our expectations for moderate growth in 2025 combined with cautious Fed easing provide a positive backdrop for leveraged credit. Our macroeconomic default model, which incorporates economic indicators and corporate fundamentals, forecasts a modest decline in default rates for both high yield and leveraged loans in 2025. With attractive all-in yields, leveraged credit still offers value for investors.
In the loan market, discount margins are wider than corporate spreads for comparable ratings, reflecting the trends loan investors are facing. Default rates are higher than in bonds, and issuers may be more vulnerable if the Fed reduces rates less than anticipated. Liability management exercises have also played a more significant role in loan defaults over the past two years. We expect the loan default rate will decline in 2025 but remain elevated relative to high yield bonds. With CCC loan discount margins remaining north of 1,200 basis points compared to CCC corporate bond spreads of only 575 basis points, it seems clear that the market anticipates a challenging default environment for floating-rate borrowers that investors should actively manage around.
In the high yield bond market, accounting for the shift to higher quality issuers makes index spreads more attractive than they appear, presenting ongoing opportunities to earn carry. Still, the gradual absorption of higher interest rates in the high yield corporate bond market necessitates a cautious approach toward credit selection.
We believe U.S. fixed income will continue to offer relative value compared to international markets, with high yield bonds and bank loans well-positioned to provide diversification and strong income in 2025. However, given heightened market volatility and uncertain Washington policy changes, investors should adopt a disciplined, selective approach to navigate the year successfully.
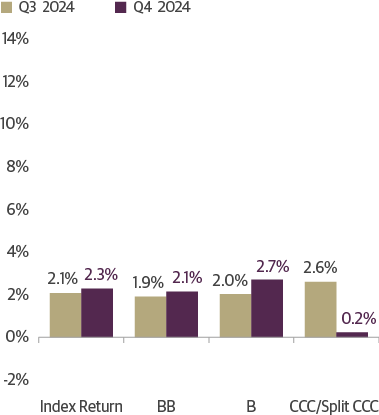
Leveraged Credit Scorecard
As of 12.31.2024
Source: ICE BofA, S&P UBS. *Discount Margin to Maturity assumes three-year average life. Past performance does not guarantee future results.
ICE BofA High Yield Index Returns
Source: ICE BofA. Data as of 12.31.2024. Past performance does not guarantee future results.
S&P UBS Leveraged Loan Index Returns
Source: S&P UBS. Data as of 12.31.2024. Past performance does not guarantee future results.
Important Notices and Disclosures
INDEX AND OTHER DEFINITIONS
The referenced indices are unmanaged and not available for direct investment. Index performance does not reflect transaction costs, fees or expenses.
The Credit Suisse Leveraged Loan Index tracks the investable market of the U.S. dollar denominated leveraged loan market. It consists of issues rated “5B” or lower, meaning that the highest rated issues included in this index are Moody’s/S&P ratings of Baa1/BB+ or Ba1/ BBB+. All loans are funded term loans with a tenor of at least one year and are made by issuers domiciled in developed countries.
The ICE BofA U.S. High Yield Index tracks the performance of US dollar denominated below investment grade corporate debt publicly issued in the US domestic market. Qualifying securities must have a below investment grade rating (based on an average of Moody’s, S&P and Fitch), at least 18 months to final maturity at the time of issuance, at least one year remaining term to final maturity as of the rebalancing date, a fixed coupon schedule and a minimum amount outstanding of $250 million. In addition, qualifying securities must have risk exposure to countries that are members of the FX-G10, Western Europe or territories of the US and Western Europe. The FX-G10 includes all Euro members, the U.S., Japan, the UK, Canada, Australia, New Zealand, Switzerland, Norway and Sweden.
A basis point (bps) is a unit of measure used to describe the percentage change in the value or rate of an instrument. One basis point is equivalent to 0.01 percent.
AAA is the highest possible rating for a bond. Bonds rated BBB or higher are considered investment grade. BB, B, and CCC-rated bonds are considered below investment grade and carry a higher risk of default, but offer higher return potential. A split bond rating occurs when rating agencies differ in their assessment of a bond.
The three-year discount margin to maturity (DMM), also referred to as discount margin, is the yield-to-refunding of a loan facility less the current three-month Libor rate, assuming a three year average life for the loan.
The interest coverage ratio is a debt and profitability ratio used to determine how easily a company can pay interest on its outstanding debt.
The leverage ratio is a metric that expresses how much of a company’s operations or assets are financed with borrowed money.
Spread is the difference in yield to a Treasury bond of comparable maturity.
Investing involves risk, including the possible loss of principal. In general, the value of a fixed-income security falls when interest rates rise and rises when interest rates fall. Longer term bonds are more sensitive to interest rate changes and subject to greater volatility than those with shorter maturities. During periods of declining rates, the interest rates on floating rate securities generally reset downward and their value is unlikely to rise to the same extent as comparable fixed rate securities. High yield and unrated debt securities are at a greater risk of default than investment grade bonds and may be less liquid, which may increase volatility. Investors in asset-backed securities, including mortgage-backed securities and collateralized loan obligations (“CLOs”), generally receive payments that are part interest and part return of principal. These payments may vary based on the rate loans are repaid. Some asset-backed securities may have structures that make their reaction to interest rates and other factors difficult to predict, making their prices volatile and they are subject to liquidity and valuation risk. CLOs bear similar risks to investing in loans directly, such as credit, interest rate, counterparty, prepayment, liquidity, and valuation risks. Loans are often below investment grade, may be unrated, and typically offer a fixed or floating interest rate.
This article is distributed for informational or educational purposes only and should not be considered a recommendation of any particular security, strategy or investment product, or as investing advice of any kind. This article is not provided in a fiduciary capacity, may not be relied upon for or in connection with the making of investment decisions, and does not constitute a solicitation of an offer to buy or sell securities. The content contained herein is not intended to be and should not be construed as legal or tax advice and/or a legal opinion. Always consult a financial, tax and/or legal professional regarding your specific situation.
This article contains opinions of the author but not necessarily those of Guggenheim Partners or its subsidiaries. The author’s opinions are subject to change without notice. Forward-looking statements, estimates, and certain information contained herein are based upon proprietary and non-proprietary research and other sources. Information contained herein has been obtained from sources believed to be reliable, but are not assured as to accuracy. No part of this article may be reproduced in any form, or referred to in any other publication, without express written permission of Guggenheim Partners, LLC. Past performance is not indicative of future results. There is neither representation nor warranty as to the current accuracy of, nor liability for, decisions based on such information.
©2025, Guggenheim Partners, LLC. No part of this article may be reproduced in any form, or referred to in any other publication, without express written permission of Guggenheim Partners, LLC. Guggenheim Funds Distributors, LLC is an affiliate of Guggenheim Partners, LLC. For information, call 800.345.7999 or 800.820.0888.
Member FINRA/SIPC GPIM 63948 GI-FIO 0625
Tune in to Macro Markets to hear the top minds of Guggenheim Investments offer timely analysis on financial market trends. Guests include portfolio managers, fixed income sector heads, members of the Macroeconomic and Investment Research Group, and more.
Guggenheim Investments represents the investment management businesses of Guggenheim Partners, LLC ("Guggenheim"). Guggenheim Funds Distributors, LLC is an affiliate of Guggenheim.
Read a prospectus and summary prospectus (if available) carefully before investing. It contains the investment objective, risks charges, expenses and the other information, which should be considered carefully before investing. To obtain a prospectus and summary prospectus (if available) click here or call 800.820.0888.
Investing involves risk, including the possible loss of principal.
*Assets under management is as of 12.31.2024 and includes leverage of $14.8bn. Guggenheim Investments represents the following affiliated investment management businesses of Guggenheim Partners, LLC: Guggenheim Partners Investment Management, LLC, Security Investors, LLC, Guggenheim Funds Distributors, LLC, Guggenheim Funds Investment Advisors, LLC, Guggenheim Corporate Funding, LLC, Guggenheim Wealth Solutions, LLC, Guggenheim Partners Europe Limited, Guggenheim Partners Japan Limited, GS GAMMA Advisors, LLC, and Guggenheim Private Investments, LLC.
This is not an offer to sell nor a solicitation of an offer to buy the securities herein. GCIF 2019 and GCIF 2016 T are closed for new investments.
©
Guggenheim Investments. All rights reserved.
Research our firm with FINRA Broker Check.
• Not FDIC Insured • No Bank Guarantee • May Lose Value
This website is directed to and intended for use by citizens or residents of the United States of America only. The material provided on this website is not intended as a recommendation or as investment advice of any kind, including in connection with rollovers, transfers, and distributions. Such material is not provided in a fiduciary capacity, may not be relied upon for or in connection with the making of investment decisions, and does not constitute a solicitation of an offer to buy or sell securities. All content has been provided for informational or educational purposes only and is not intended to be and should not be construed as legal or tax advice and/or a legal opinion. Always consult a financial, tax and/or legal professional regarding your specific situation. Investing involves risk, including the possible loss of principal.
By choosing an option below, the next time you return to the site, your home page will automatically
be set to this site. You can change your preference at any time.
We have saved your site preference as
Institutional Investors. To change this, update your
preferences.
United States Important Legal Information
By confirming below that you are an Institutional Investor, you will gain access to information on this website (the “Website”) that is intended exclusively for Institutional Investors and, as such, the information should not be relied upon by individual investors. This Website and any product, content, information, tools or services provided or available through the Website (collectively, the “Services”) are provided to Institutional Investors for informational purposes only and do not constitute a recommendation to buy or sell any security or fund interest. Nothing on the Website shall be considered a solicitation for the offering of any investment product or service to any person in any jurisdiction where such solicitation or offering may not lawfully be made. By accessing this Website, you expressly acknowledge and agree that the Website and the Services provided on or through the Website are provided on an as is/as available basis, and except as partnered by law, neither Guggenheim Investments and it parents, subsidiaries and affiliates nor any third party has any responsibility to maintain the website or the Services offered on or through the Website or to supply corrections or updates for the same. You understand that the information provided on this Website is not intended to provide, and should not be relied upon for, tax, legal, accounting or investment advice. You also agree that the terms provided herein with respect to the access and use of the Website are supplemental to and shall not void or modify the Terms of Use in effect for the Website. The information on this Website is solely intended for use by Institutional Investors as defined below: banks, savings and loan associations, insurance companies, and registered investment companies; registered investment advisers; individual investors and other entities with total assets of at least $50 million; governmental entities; employee benefit (retirement) plans, or multiple employee benefit plans offered to employees of the same employer, that in the aggregate have at least 100 participants, but does not include any participant of such plans; member firms or registered person of such a member; or person(s) acting solely on behalf of any such Institutional Investor.
By clicking the "I confirm" information link the user agrees that: “I have read the terms detailed and confirm that I am an Institutional Investor and that I wish to proceed.”